Sampling
This notebook illustrates the different probability distributions that can be used to generate datasets of physical parameters.
[1]:
import os
import sys

sys.path.insert(0, os.path.join(".."))

import numpy as np
import matplotlib.pyplot as plt

from infobs.sampling import samplers
from infobs.sampling import Mixture
Predefined samplers
[2]:
samplers.__all__ # Sampler is the abstract class from which all samplers inherit
[2]:
['Sampler', 'Constant', 'Uniform', 'LogUniform', 'BoundedPowerLaw']
[3]:
cst = samplers.Constant(1.0)
cst.get(5)
[3]:
array([1., 1., 1., 1., 1.])
[4]:
unf = samplers.Uniform(0.0, 1.0)
unf.get(5)
[4]:
array([0.39079479, 0.026211 , 0.56833878, 0.19770359, 0.52410246])
[5]:
logunf = samplers.LogUniform(1, 10)
logunf.get(5)
[5]:
array([7.30769182, 4.33391842, 1.17338091, 4.69312246, 8.30467105])
[6]:
bdpl = samplers.BoundedPowerLaw(0.5, 1, 10)
bdpl.get(5)
[6]:
array([6.79175107, 3.53320021, 3.82415888, 4.71669006, 4.05413621])
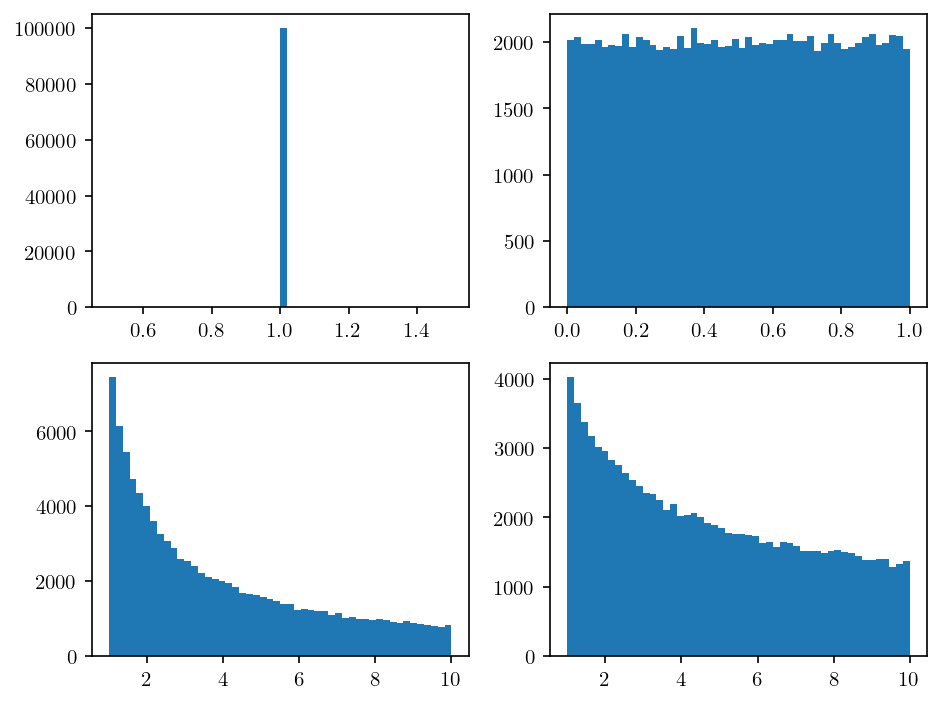
[7]:
n_samples = 100_000
bins = 50

plt.figure(dpi=150)

plt.subplot(2, 2, 1)
x = cst.get(n_samples)
plt.hist(x, bins)

plt.subplot(2, 2, 2)
x = unf.get(n_samples)
plt.hist(x, bins)

plt.subplot(2, 2, 3)
x = logunf.get(n_samples)
plt.hist(x, bins)

plt.subplot(2, 2, 4)
x = bdpl.get(n_samples)
plt.hist(x, bins)

plt.tight_layout()
plt.show()
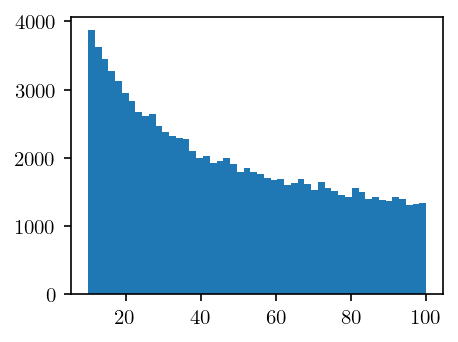
New samplers from existing ones
[8]:
bdpl2 = bdpl.copy_other_bounds(10, 100)
bdpl2.get(5)
[8]:
array([26.80674634, 53.89577313, 13.49510575, 31.95299392, 40.06931273])
[9]:
plt.figure(dpi=150, figsize=(0.5 * 6.4, 0.5 * 4.8))

x = bdpl2.get(n_samples)
plt.hist(x, bins)

plt.show()
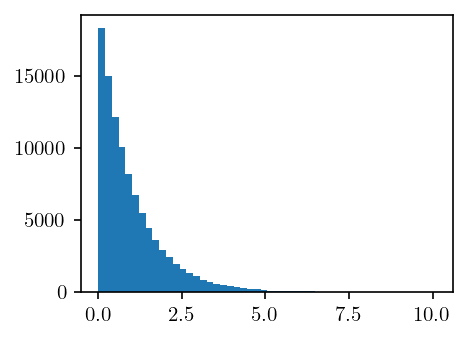
Defining your own samplers
[10]:
class Exponential(samplers.Sampler):
    def __init__(self, lamda: float):
        """
        TODO
        """
        assert lamda > 0

        self.lamda = lamda

    def get(self, n: int) -> np.ndarray:
        """
        TODO
        """
        return np.random.exponential(self.lamda, n)
[11]:
exp = Exponential(1.0)
exp.get(5)
[11]:
array([0.59646487, 1.16991262, 0.79159345, 0.16810737, 0.72334426])
[12]:
plt.figure(dpi=150, figsize=(0.5 * 6.4, 0.5 * 4.8))

x = exp.get(n_samples)
plt.hist(x, bins)

plt.show()
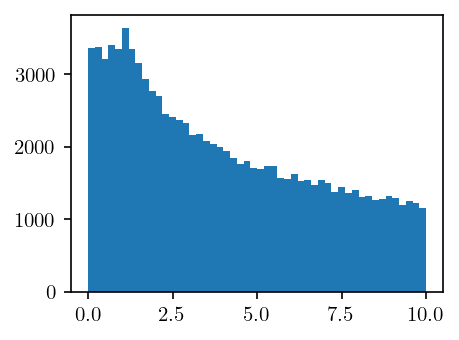
Samplers mixture
[32]:
mxt = Mixture([unf, bdpl], [1, 5])

mxt.get(5)
[32]:
array([4.05883558, 7.8928761 , 1.00402175, 9.12008436, 1.31337906])
[33]:
plt.figure(dpi=150, figsize=(0.5 * 6.4, 0.5 * 4.8))

x = mxt.get(n_samples)
plt.hist(x, bins)

plt.show()