IRAM 30m EMIR spectral bands
[1]:
import os
import sys

import matplotlib.pyplot as plt

sys.path.insert(0, os.path.join(".."))

from infobs.instruments import IRAM30mEMIR
from infobs.graphics import Settings

Settings.rotational_only = True

transitions = True  # Set to False to hide line transitions
[2]:
linewidth = 10  # km/s

emir = IRAM30mEMIR(linewidth)
[3]:
lines = [
    "hcn_j1_f2__j0_f1",
    "hcop_j1__j0",
    "hnc_j1__j0",
    "cs_j2__j1",
    "c_18o_j1__j0",
    "13c_o_j1__j0",
    "cn_n1_j0d5__n0_j0d5",
    "cn_n1_j1d5__n0_j0d5",
    "co_v0_j1__v0_j0",
    "cs_j3__j2",
    "c2h_n2d0_j2d5_f3d0__n1d0_j1d5_f2d0",
    "hcn_j2_f3__j1_f2",
    "hcop_j2__j1",
    "c_18o_j2__j1",
    "13c_o_j2__j1",
    "cn_n2_j1d5__n1_j0d5",
    "cn_n2_j2d5__n1_j1d5",
    "co_v0_j2__v0_j1",
    "cs_j5__j4",
    "c2h_n3d0_j3d5_f4d0__n2d0_j2d5_f3d0",
    "c2h_n3d0_j2d5_f3d0__n2d0_j1d5_f2d0",
    "hcn_j3_f3__j2_f3",
    "hcop_j3__j2",
    "hnc_j3__j2",
    "cs_j6__j5",
    "c_18o_j3__j2",
    "13c_o_j3__j2",
    "cn_n3_j2d5__n2_j1d5",
    "cn_n3_j3d5__n2_j2d5",
    "cs_j7__j6",
    "co_v0_j3__v0_j2",
    "c2h_n4d0_j4d5_f5d0__n3d0_j3d5_f4d0",
    "hcop_j4__j3",
]

obstime = 60  # seconds
EMIR bands
[4]:
list(emir.bands().keys())
[4]:
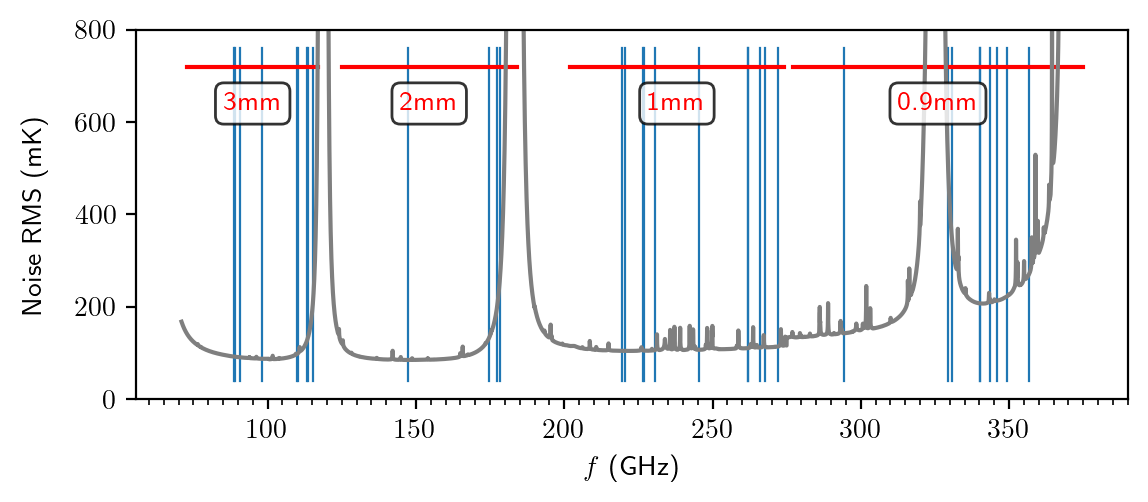
['3mm', '2mm', '1mm', '0.9mm']
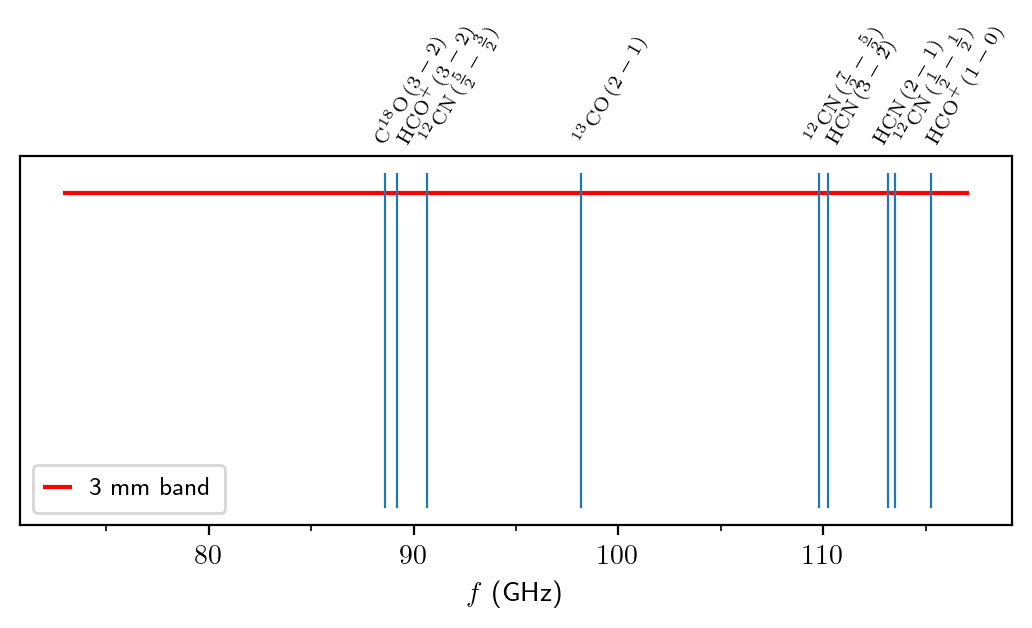
Display a given EMIR band without noise profile
[5]:
plt.figure(figsize=(6.4, 0.5 * 4.8), dpi=200)

emir.plot_band("3mm", lines, transitions=transitions)
plt.show()
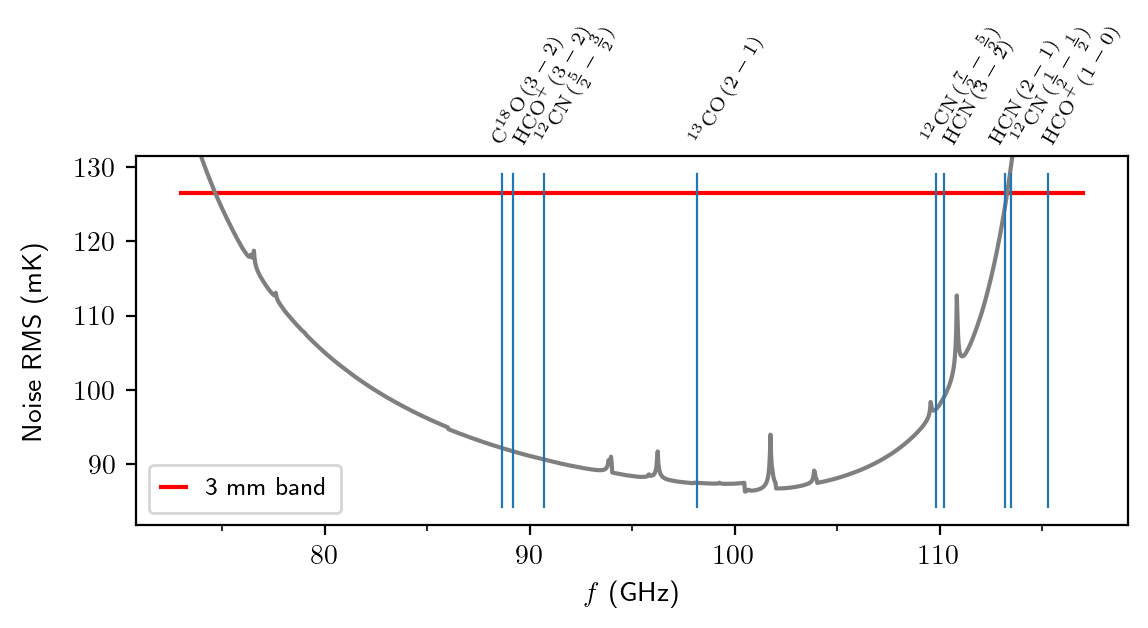
Display a given EMIR band with noise profile
[6]:
plt.figure(figsize=(6.4, 0.5 * 4.8), dpi=200)

emir.plot_band("3mm", lines, obstime, transitions=transitions)

plt.show()
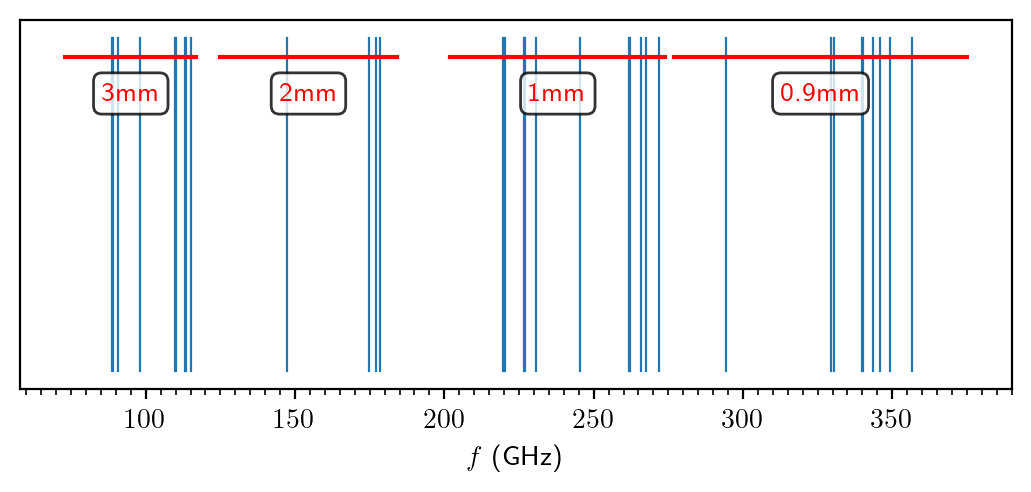
Display all EMIR bands
[7]:
plt.figure(figsize=(6.4, 0.5 * 4.8), dpi=200)

emir.plot_band("all", lines, transitions=transitions)

plt.show()
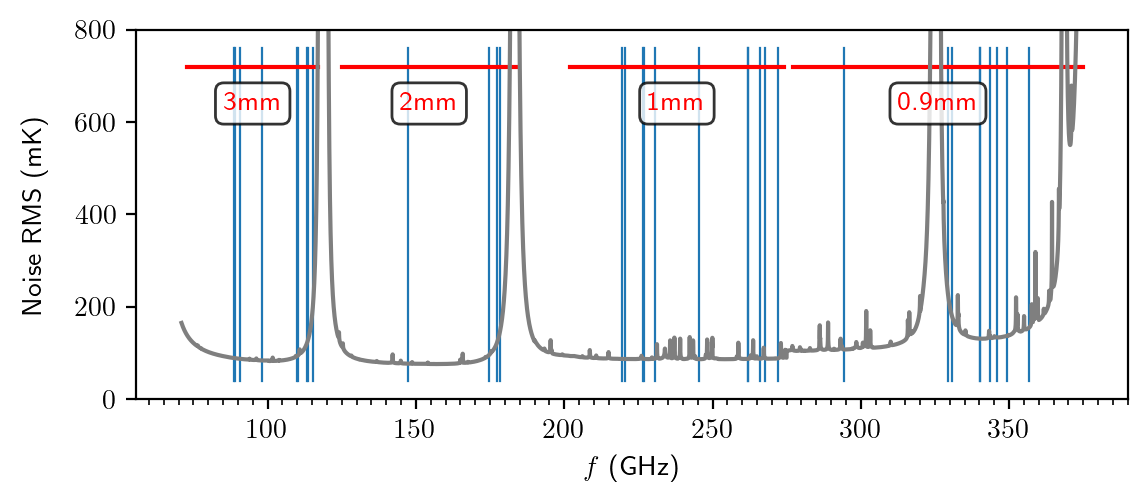
Display all EMIR bands with noise profile
[8]:
plt.figure(figsize=(6.4, 0.5 * 4.8), dpi=200)

emir.plot_band("all", lines, obstime)

plt.show()
Changing observing conditions
[9]:
linewidth = 10  # km/s

emir = IRAM30mEMIR(
    linewidth, ipwv=0  # millimeter of precipitable water vapor (default: 2)
)
[10]:
plt.figure(figsize=(6.4, 0.5 * 4.8), dpi=200)

emir.plot_band("all", lines, obstime)

plt.show()